Abstract
Introduction: The International Prostate Symptom Score (I-PSS) is a tool to assess the symptoms and therapeutic efficacy. Evaluation of nocturia is difficult due to the high degree of subjectivity. Although it was believed that the I-PSS score is closely related to prostate volume, now it is proven that it does not significantly affect prostate symptoms. Therefore, we need to identify other variables that correlate better with the odds of nocturia frequency.
Objectives: To identify one or more effective indicators of nocturia frequency in prostate hypertrophy in the family doctor’s office, measured during suprapubic ultrasound examination in two incidents: the perimeter, transverse diameter, anteroposterior diameter and the craniocaudal diameter.
Material and Methods: The study included 220 patients divided into a study group of 111 patients with nocturia and respectively the control group of 109 patients without nocturia. The study group was divided into four subgroups depending on the frequency of nocturia: 1-2 times (47 patients), 2-3 times (32 patients), 3-4 times (22 patients) and more than 4 times per night (10 patients). Patients were examined with an echograph using a convex transducer and the software for prostate volume calculation, by a certified family physician who has complementary studies in general ultrasound, performing the measurements in two incidences of prostate -transverse respectively sagittal- of the perimeter, transverse diameter, height (craniocaudal diameter) and anteroposterior diameter (sagittal).
Results: We found a strong positive relationship between measurements of the same size of the prostate by the two methods. The transverse diameter has a strong correlation in the overall group, control group, subgroups 2 and 4, but a moderate relationship in the subgroups 1 and 3. The sagittal diameter has a strong relationship in all groups and subgroups, except the subgroup 1. The craniocaudal diameter is the only one which has a strong relationship in all subgroups. The sagittal diameter has the largest proportional increase (15.51%) in group with nocturia compared to control group and compared with the transverse diameter (14.97%) or craniocaudal (14.08%). The perimeter of prostate measured in transverse section had statistically significant differences compared to the control group regardless of the frequency of nocturia, and in the subgroups it had small differences. The perimeter in the sagittal section, shows a statistically significant difference compared to control group, in addition, in subgroups, there are significant differences between both subgroups 3 to 1 and to the subgroup 2. The transverse diameter in method 1 shows statistically significant differences in all subgroups with nocturia compared with the control group, and also between the subgroups 1 and 2, and in the second method shows a significant difference between the subgroups and the control group, but also between 1 and 2, 3 and 1 and insignificant between 3 and 2. The sagittal diameter measured in method 1 has values significantly different in subgroups compared with the control group, but in subgroups has significant differences only between subgroups 3 and 1, and measured by the second method does not show significant differences between the subgroups with nocturia. The craniocaudal diameter in transverse section, the second method, has significant differences only for highlighting the nocturia compared with the control group, and in the sagittal section, has no significant differences than between subgroups 1,2 and 3 and control group.
Conclusions: the craniocaudal diameter is the size which is maintaining itself relatively between the same ranges throughout the evolution of the nocturia, the hypertrophy affecting other dimensions. It is possible that not the global increase in the size of the prostate to be the cause of the nocturia frequency of 4 times or more, but the hypertrophy of the transition zone around the urethra. The sagittal diameter has the largest proportional increase in the nocturia group compared with the control group, but only this is not enough to solve the odds of the nocturia symptoms, but only to highlight the general hypertrophy. Measurement of the perimeter of the prostate in sagittal section may provide clues regarding the odds of frequency of nocturia, at least for the level of 3-4 times. The measurement of the transverse diameter by method 1 would be useful for the odds of the frequency of nocturia of 1-2 times vs. 2-3 times, and through the second method can distinguish the nocturia frequency between subgroup 1 and 2, and between 3 and 1. An algorithm that uses transverse diameter and the sagittal perimeter could make a difference between the frequency of nocturia 1-2 times, 2-3 times and 3-4 times, frequencies which constitute an absolute majority of the nocturia frequency at the presentation of the patient to the family doctor’s office.
Keywords: family medicine, prostate hypertrophy, suprapubic ultrasound, diameter, perimeter, frequency of nocturia
Introduction
The International Prostate Symptom Score (I-PSS) is a tool to assess the symptoms and therapeutic efficacy. Measurement of the prostate size, individually, or in order to determine the volume [1] is a good criterion for overall assessment of the prostatic hypertrophy (PHT) in primary care.
Nocturia is an irritative sign in I-PSS, its evaluation is difficult due to the high degree of subjectivity, between 56% [2] and 70% [3] of patients with PHT present with two or more episodes of nocturia. In a previous study [1] we have shown that the change in nocturia frequency for which the increasing of prostate volume is statistically significant compared to other frequencies of the nocturia, is only from 3-4 times, which in terms of the evaluation of nocturia frequency on the base of the ultrasound examination in primary care is unsatisfactory. Although it was believed [2] that the I-PSS score is closely related to prostate volume which increases with patient age, it is proved that prostate volume does not significantly affect prostatic symptoms [4,5]. Therefore, we need to identify other variables that correlate better with the odds of the nocturia frequency.
Objectives: to identify one or more effective indicators of nocturia frequency in prostate hypertrophy in family doctor’s office, measured during suprapubic ultrasound examination in two incidents: the perimeter, transverse diameter, anteroposterior diameter and the craniocaudal diameter.
Material and Methods
In this retrospective controlled study, were examined with suprapubic ultrasound 220 male patients aged between 14 and 89 years, average 48.7 years, using the same type of ultrasound device with convex transducer and by the same certified family physician with complementary studies in general ultrasound. Patients were examined, without regard to the reason of presentation in the order of the presentation to the family medicine office, performing the measurements for calculation of the proastate’s volume in two incidences -transverse respectively sagittal- of the perimeter, transverse diameter, and anteroposterior diameter (sagittal) (first method), height (craniocaudal diameter), transverse diameter and anteroposterior diameter (second method), Figure 1 A,B. The 220 patients were divided into two groups: a study group of 111 patients with nocturia and respectively the control group of 109 patients without nocturia. The study group was also divided into four subgroups depending on the frequency of nocturia: 1-2 times (47 patients), 2-3 times (32 patients), 3-4 times (22 patients) and more than 4 times per night (10 patients).
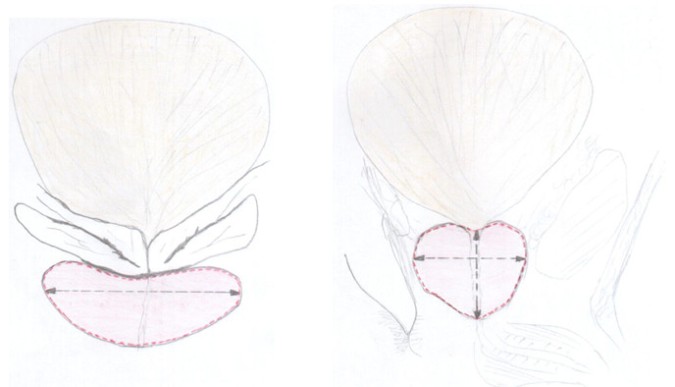
Figure 1. A: Measurements of the perimeter and the transverse diameter of the prostate in the transversal incidence. B: Measurements of the perimeter, and the craniocaudal and anteroposterior diameter of the prostate in the sagittal incidence
Statistical analysis
The results were expressed as mean value±SD. Calculation of the Pearson coefficient was used for correlation analysis between two variables, and the independent two-sided t was used for analysis of the differences between two sets of variables. The results were considered significant for p<0.05.
Results
To determine the possibility of error in measurements we calculated the Pearson coefficient for the transverse and sagittal diameter during the two types of measurements to measure the prostate volume through ellipsoid formula; also for the height of the prostate (craniocaudal diameter) in transverse and sagittal incidence (Table I, II, III).
The r values, taking into account the entire population examined with ultrasound, shows a strong positive relationship between the same measurements of the prostate performed for the calculation of the prostate volume by two methods: measuring of the perimeter and transverse diameter (Table I) in the transverse incidence, and the perimeter and anteroposterior diameter (Table II) within the sagittal incidence, and respectively measuring the height on transverse incidence, and transversal diameter and height in sagittal incidence (Table III) and the anteroposterior diameter. Consequently, there are no statistically significant differences in the measurements of the same size at different stages of the examination in the general population. Also, neither in the control group there are no significant differences for the measurements of the same size.
The transverse diameter measured in the two methods has a strong correlation in the general group, control group, subgroups 2 and 4, but a moderate relationship in subgroups 1 and 3, although the difference between the mean measurements in subgroup 3 is only 0.68 mm (Table I). The strongest relationship is in subgroup 2 and is accompanied by the biggest difference between the mean measurements of all groups, suggesting that not the scattering of the measurements string could be the cause of the moderate relation in the subgroups 1 and 3.
Table I. The relation between the measurements of the prostate transverse diameter in the studied groups through the two calculation methods for prostate volume
| Mean+SD (mm) method 1 | Mean+SD (mm) method 2 | The difference of mean (mm) | Pearson Coefficient | Relation | |
| Total population | 41.34+6.72 | 40.33+6.38 | 1.00 | r=0.81 | strong |
| Control group | 38.52+5.37 | 37.73+5.09 | 0.79 | r=0.84 | strong |
| Subgroup 1 | 43.29+6.22 | 42.10+6.24 | 1.19 | r=0.66 | moderate |
| Subgroup 2 | 46.31+7.38 | 44.9+7.56 | 1.41 | r=0.90 | strong |
| Subgroup 3 | 45.36+7.6 | 46.04+7.72 | 0.68 | r=0.62 | moderate |
| Subgroup 4 | 42.6+7.63 | 41.5+5.80 | 1.10 | r=0.88 | strong |
The sagittal diameter (anteroposterior) measured by the two methods has a strong relationship in all groups and subgroups, except for subgroup 1 (Table II).
Table II. The relation between the measurements of the prostate sagittal diameter in the studied groups through the two calculation methods for prostate volume
| Mean+SD (mm) method 1 | Mean+SD (mm) method 2 | The difference of mean (mm) | Pearson Coefficient | Relation | |
| Total population | 40.82+6.75 | 39.16+6.20 | 1.66 | r=0.80 | strong |
| Control group | 38+5.49 | 36.31+5.07 | 1.69 | r=0.77 | strong |
| Subgroup 1 | 43.02+5.53 | 41.48+5.12 | 1.54 | r=0.59 | moderate |
| Subgroup 2 | 43.96+6.63 | 43.37+6.69 | 0.59 | r=0.83 | strong |
| Subgroup 3 | 46.82+8.48 | 44.55+7.42 | 2.27 | r=0.79 | strong |
| Subgroup 4 | 42.6+7.92 | 39.6+6.86 | 3.00 | r=0.90 | strong |
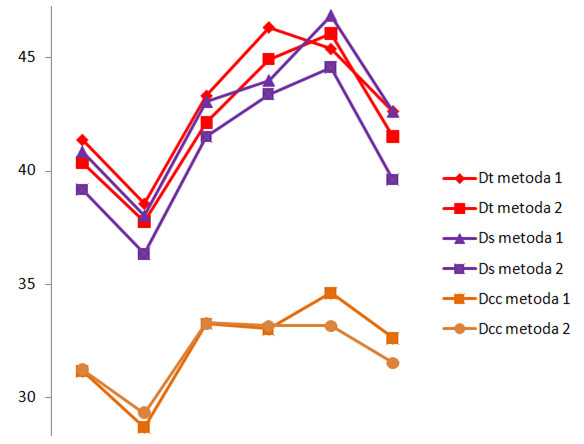
From the dimensions measured by the two methods, the craniocaudal diameter is the only with a strong relationship in all subgroups (Table III). Moreover, is the size that has the smallest difference between the mean values of the measurements (Figure 2). This suggests that the height of the prostate is the parameter which has the lowest variability of the measurement in transverse section, respectively sagittal, for different frequencies of nocturia. Also this is demonstrated by the result of the Student’s two-sided t test, showing that the measurement differences are statistically insignificant among all subgroups (Table IX). In conclusion, the craniocaudal diameter is the dimension which is kept relatively in the same range throughout the evolution of the nocturia, from 1 to more than 4 times. However, the presence of the nocturia in itself lead to significant differences in measuring the craniocaudal diameter vs. the control group. Prostatic hypertrophy apparently did not lead to the increasing of the height of the prostate, but is affecting the other dimensions of the prostate.
Table III. The relation between the measurements of the prostate craniocaudal diameter in the studied groups through the two calculation methods for prostate volume
| Mean+SD (mm) method 1 | Mean+SD (mm) method 2 | The difference of mean (mm) | Pearson Coefficient | Relation | |
| Total population | 31.15+6.42 | 31.21+5.72 | 0.05 | r=0.83 | strong |
| Control group | 28.66+5.42 | 29.29+4.65 | 0.63 | r=0.79 | strong |
| Subgroup 1 | 33.23+6.25 | 33.27+5.79 | 0.04 | r=0.77 | strong |
| Subgroup 2 | 33+7.74 | 33.15+7.7 | 0.15 | r=0.86 | strong |
| Subgroup 3 | 34.59+7.58 | 33.14+7.69 | 1.45 | r=0.88 | strong |
| Subgroup 4 | 32.6+7.57 | 31.5+5.76 | 1.10 | r=0.92 | strong |
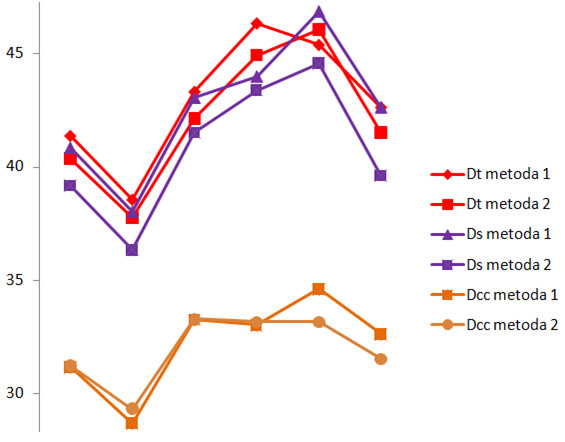
Figure 2. The differences between the mean values of the measured transverse diameter (Dt), the sagittal diameter (Ds) and the craniocaudal diameter (Dcc) by the two methods
The mean±SD of dimensions measured by the two methods, which are within 68.2% of the values, did not show significant variations of SD between the measured dimensions. Also, the difference between the mean of both sets of measurements through the two methods, between the same measured dimensions, is very low, generally less than 2 mm (Tables I, II, III, Figure 1), indicating that the source of the moderate relations of the Pearson coefficient is not the error of the examiner.
Seemingly paradoxical, the strongest relationship of all dimensions measured in both incidents was in the subgroup 4, even though the mean of these values was closest to the general population (control and study group) (Table IV). This suggests that not the overall increase in the size of the prostate is the cause of the nocturia frequency of 4 times and over, the prostate maintaining the proportions and even the size very close to the mean of the population, but more likely a hypertrophy of the transition zone around the urethra. Subgroup 4 still has too few subjects to validate statistical those data.
Table IV. The relation between the prostate dimensions in the groups studied
| group | transverse diameter | sagittal diameter | craniocaudal diameter | data |
| Total population
n=216 |
1.00 | 1.66 | 0.05 | the difference of mean (mm) |
| 0.81 | 0.80 | 0.83 | r | |
| strong | strong | strong | relation | |
| Control group
n=109 |
0.79 | 1.69 | 0.63 | the difference of mean (mm) |
| 0.84 | 0.77 | 0.79 | r | |
| strong | strong | strong | relation | |
| Subgroup 1
n=47 |
1.19 | 1.54 | 0.04 | the difference of mean (mm) |
| 0.66 | 0.59 | 0.77 | r | |
| moderate | moderate | strong | relation | |
| Subgroup 2
n=32 |
1.41 | 0.59 | 0.15 | the difference of mean (mm) |
| 0.90 | 0.83 | 0.77 | r | |
| strong | strong | strong | relation | |
| Subgroup 3
n=22 |
0.68 | 2.27 | 1.45 | the difference of mean (mm) |
| 0.62 | 0.79 | 0.88 | r | |
| moderate | strong | strong | relation | |
| Subgroup 4
n=10 |
1.10 | 3.00 | 1.10 | the difference of mean (mm) |
| 0.88 | 0.90 | 0.92 | r | |
| strong | strong | strong | relation |
Comparison of the mean increase in prostate dimensions in the hypertrophy of the prostate than the control group showed that the sagittal diameter has the biggest proportional increase (15.51%) in the group with nocturia than the control group, compared to the transverse diameter (14.97%), or craniocaudal (14.08%) (Figure 3).
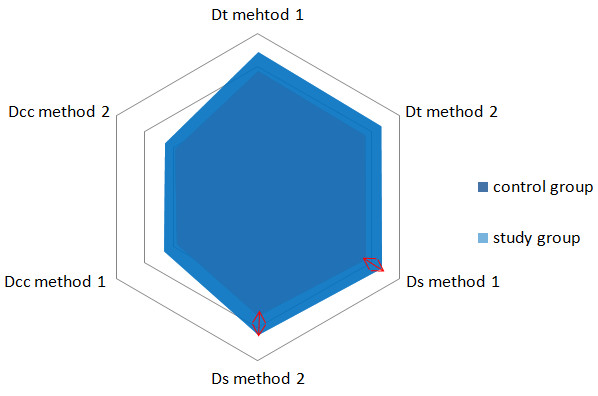
Figure 3. Increasing of the transverse diameter (Dt), sagittal (Ds) and craniocaudal (Dcc) of the prostate in the study group compared to the control group. The largest increase is for the sagittal diameters
The perimeter of the prostate, measured in transverse section had statistically significant differences compared to the control group regardless of the frequency of nocturia, and in the subgroups with nocturia had significant differences. The independent measurement of this parameter does not correlate with the frequency of nocturia, being significant only as a general indicator for nocturia (Table V).
Table V. The difference between the values for perimeter measured in transverse section (the first method) between the subgroups with nocturia and control group, respectively between subgroups (t-test independent, two-sided)
| Group/
subgroup |
Standard deviation | Standard error
|
No. | Arithmetic mean | Independent t test | p | P signification | |||||
| control | 230.82 | – | 109 | 834.49 | – | – | – | |||||
| 1 | 331.58 | 53.18 | 47 | 1063.8 | t(154)(1vs.c)=4.3131 | p<0.001 | significantly | |||||
| 2 | 431.84 | 90.37 | 32 | 1174.5 | t(77)(2vs.1)=1.2241 | p>0.05 | insignificant | |||||
| 3 | 376.13 | 93.64 | 22 | 1176.8 | t(67)(3vs.1)=1.2059 | p>0.05 | insignificant | |||||
| 4 | 441.72 | 110.71
141.42 |
–
10 |
–
1139.1 |
t(52)(3vs.2)=0.0208
t(117)(4vs.c)=2.1538 |
p>0.1
p<0.02 |
insignificant significantly | |||||
t(df)(a vs. b)=c, the t test (df=degrees of freedom) (a=subgroup vs. b=control group/other subgroup), independent two-sided
The measurement of the same type of parameter, the perimeter of the prostate, but in the sagittal section, show a statistically significant difference compared to the control group, but in addition, in subgroups, exist significant differences both between subgroups 3 vs. 1 and vs. the subgroup 2. The subgroup with a frequency of nocturia of 4 times show a significant increase compared to the subgroups 1 and 2, but a lower value than in the subgroup 3 (Table VI). The measurement of this parameter can provide significant clues regarding not only the presence of the nocturia, but also for the odds of frequency, at least at the level of 3 times.
Table VI. The difference between the values for perimeter measured in sagittal section (the first method) between the subgroups with nocturia and control group, respectively between subgroups (t-test independent, two-sided)
| Group/
subgroup |
Standard deviation | Standard error | No. | arithmetic mean | Independent t test | p | P signification | |||||||||
| control | 221.01 | – | 109 | 828.68 | – | – | – | |||||||||
| 1 | 266.44 | 44.25 | 47 | 1091.7 | t(154)(1vs.c)=5.9437 | p<0.001 | significantly | |||||||||
| 2 | 381.74 | 77.87 | 32 | 1079.6 | t(77)(2vs.1)=0.1548 | p>0.1 | insignificant | |||||||||
| 3 | 589.31 | 131.51 | 22 | 1321.8 | t(67)(3vs.1)=1.7497 | p<0.05 | significantly | |||||||||
| 4 | 507.27 | 142.61
161.80 |
–
10 |
–
1202.6 |
t(52)(3vs.2)=1.6981
t(117)(4vs.c)=2.3108 |
p<0.05
p<0.02 |
significantly significantly | |||||||||
t(df)(a vs. b)=c, the t test (df=degrees of freedom) (a=subgroup vs. b=control group/other subgroup), independent two-sided
Measuring the transverse diameter in the first method of calculating of prostate volume show statistically significant differences for all subgroups with nocturia compared with the control group, but also between the subgroups 1 and 2, but without showing the same significance between the remaining subgroups (Table VII). This parameter could be useful to differentiate the frequency of nocturia of 1-2 times with the one of 2-3 times.
Table VII. The difference of the values for the transverse diameter measured (the first method) between the subgroups with nocturia and control group, respectively between subgroups (t-test independent, two-sided)
| Group/
subgroup |
Standard deviation | Standard error | No. | arithmetic mean | Independent t test | p | P signification | |||||||||
| control | 5.34 | – | 109 | 38.52 | – | – | – | |||||||||
| 1 | 6.15 | 1.033 | 47 | 43.29 | t(154)(1vs.c)=4.6123 | p<0.001 | significantly | |||||||||
| 2 | 7.26 | 1.566 | 32 | 46.31 | t(77)(2vs.1)=1.9282 | p<0.05 | significantly | |||||||||
| 3 | 7.42 | 1.819 | 22 | 45.36 | t(67)(3vs.1)=1.1394 | p>0.1 | insignificant | |||||||||
| 4 | 7.24 | 2.038
2.346 |
–
10 |
–
42.60 |
t(52)(3vs.2)=0.4643
t(117)(4vs.c)=1.7374 |
p>0.1
p<0.05 |
insignificant significantly | |||||||||
t(df)(a vs. b)=c, the t test (df=degrees of freedom) (a=subgroup vs. b=control group/other subgroup), independent two-sided
The sagittal diameter measured during the first method for determining prostate volume has values of the measurement significantly different in the subgroups with nocturia compared with the control group, but in subgroups has only the significance to differentiate between the subgroup 3 and 1 (Table VIII).
Table VIII. The difference of the values for the sagittal diameter measured (the first method) between the subgroups with nocturia and control group, respectively between subgroups (t-test independent, two-sided)
| Group/
subgroup |
Standard deviation | Standard error | No. | arithmetic mean | Independent t test | p | P signification | |||||||||
| control | 5.46 | – | 109 | 38 | – | – | – | |||||||||
| 1 | 5.47 | 0.955 | 47 | 43.02 | t(154)(1vs.c)=5.2565 | p<0.001 | significantly | |||||||||
| 2 | 6.52 | 1.403 | 32 | 43.96 | t(77)(2vs.1)=0.6699 | p>0.1 | insignificant | |||||||||
| 3 | 8.28 | 1.938 | 22 | 46.81 | t(67)(3vs.1)=1.9597 | p<0.05 | significantly | |||||||||
| 4 | 7.51 | 2.109
2.432 |
–
10 |
–
42.60 |
t(52)(3vs.2)=1.3549
t(117)(4vs.c)=3.6247 |
p>0.1
p<0.001 |
insignificant | |||||||||
t(df)(a vs. b)=c, the t test (df=degrees of freedom) (a=subgroup vs. b=control group/other subgroup), independent two-sided
The measurement of the craniocaudal diameter (the height) of the prostate in transverse section in the second method for determining the prostate volume has statistically significant differences only for highlighting the nocturia compared to the control group (Table IX).
Table IX. The difference of the values for the craniocaudal diameter measured in transverse section (the second method) between the subgroups with nocturia and control group, respectively between subgroups (t-test independent, two-sided)
| Group/
subgroup |
Standard deviation | Standard error | No. | arithmetic mean | Independent t test | p | P signification | |||||||||
| control | 5.39 | – | 109 | 28.66 | – | – | – | |||||||||
| 1 | 6.18 | 1.039 | 47 | 33.23 | t(154)(1vs.c)=4.3944 | p<0.001 | significantly | |||||||||
| 2 | 7.61 | 1.621 | 32 | 33 | t(77)(2vs.1)=0.1418 | p>0.05 | insignificant | |||||||||
| 3 | 7.40 | 1.818 | 22 | 34.59 | t(67)(3vs.1)=0.7476 | p>0.05 | insignificant | |||||||||
| 4 | 7.18 | 2.075
2.330 |
–
10 |
–
32.60 |
t(52)(3vs.2)=0.7659
t(117)(4vs.c)=1.6906 |
p>0.05
p<0.05 |
insignificant significantly | |||||||||
t(df)(a vs. b)=c, the t test (df=degrees of freedom) (a=subgroup vs. b=control group/other subgroup), independent two-sided
The craniocaudal diameter measured in the same method, but in the sagittal section, has no statistically significant differences, only just between subgroups 1,2 and 3 and the control group (Table X).
Table X. The difference of the values for the craniocaudal diameter measured in sagittal section (the second method) between the subgroups with nocturia and control group, respectively between subgroups (t-test independent, two-sided)
| Group/
subgroup |
Standard deviation | Standard error | No. | arithmetic mean | Independent t test | p | P signification | |||||||||
| control | 4.63 | – | 109 | 29.29 | – | – | – | |||||||||
| 1 | 5.73 | 0.946 | 47 | 33.27 | t(154)(1vs.c)=4.200 | p<0.001 | significantly | |||||||||
| 2 | 7.57 | 1.579 | 32 | 33.15 | t(77)(2vs.1)=0.0759 | p>0.1 | insignificant | |||||||||
| 3 | 7.50 | 1.806 | 22 | 33.13 | t(67)(3vs.1)=0.0740 | p>0.1 | insignificant | |||||||||
| 4 | 5.46 | 2.087
1.783 |
–
10 |
–
31.50 |
t(52)(3vs.2)=0.0065
t(117)(4vs.c)=1.2369 |
p>0.1
p>0.1 |
insignificant insignificant | |||||||||
t(df)(a vs. b)=c, the t test (df=degrees of freedom) (a=subgroup vs. b=control group/other subgroup), independent two-sided
The transverse diameter measurement through the second method for determining prostate volume show a significant difference between the subgroups and the control group, but also between the subgroups 1 vs 2, 3 vs 1 and insignificant between 3 vs 2. Measuring this parameter can differentiate the frequency of nocturia between the subgroup 1 and 2, and between 3 and 1 (Table XI).
An algorithm that uses transverse diameter and the sagittal perimeter could make a difference between the frequency of nocturia 1-2 times, 2-3 times and 3-4 times, frequencies which constitute an absolute majority of the nocturia frequency at the presentation of the patient to the family doctor’s office.
Table XI. The difference of the values for the transversal diameter measured (the second method) between the subgroups with nocturia and control group, respectively between subgroups (t-test independent, two-sided)
| Group/
subgroup |
Standard deviation | Standard error | No. | arithmetic mean | Independent t test | p | P signification | |||||||||
| control | 5.07 | – | 109 | 37.73 | – | – | – | |||||||||
| 1 | 6.17 | 1.023 | 47 | 42.10 | t(154)(1vs.c)=4.264 | p<0.001 | significantly | |||||||||
| 2 | 7.43 | 1.594 | 32 | 44.9 | t(77)(2vs.1)=1.756 | p<0.001 | significantly | |||||||||
| 3 | 7.54 | 1.843 | 22 | 46.04 | t(67)(3vs.1)=2.140 | p<0.05 | significantly | |||||||||
| 4 | 5.50 | 2.076
1.805 |
–
10 |
–
41.50 |
t(52)(3vs.2)=0.551
t(117)(4vs.c)=2.085 |
p>0.1
p<0.02 |
insignificant significantly | |||||||||
t(df)(a vs. b)=c, the t test (df=degrees of freedom) (a=subgroup vs. b=control group/other subgroup), independent two-sided
The sagittal diameter measured for determining the prostate volume during the second method may be useful just to differentiate the presence of nocturia compared with the control group, with no statistically significant differences between subgroups with nocturia (Table XII).
Table XII. The difference of the values for the sagittal diameter measured (the second method) between the subgroups with nocturia and control group, respectively between subgroups (t-test independent, two-sided)
| Group/
subgroup |
Standard deviation | Standard error | No. | arithmetic mean | Independent t test | p | P signification | |||||||||
| control | 5.05 | – | 109 | 36.31 | – | – | – | |||||||||
| 1 | 5.06 | 0.883 | 47 | 41.48 | t(154)(1vs.c)=5.850 | p<0.001 | significantly | |||||||||
| 2 | 6.58 | 1.378 | 32 | 43.37 | t(77)(2vs.1)=1.370 | p>0.1 | insignificant | |||||||||
| 3 | 7.25 | 1.713 | 22 | 44.54 | t(67)(3vs.1)=0.685 | p>0.1 | insignificant | |||||||||
| 4 | 6.51 | 1.935
2.116 |
–
10 |
–
39.60 |
t(52)(3vs.2)=0.607
t(117)(4vs.c)=1.553 |
p>0.1
p>0.1 |
insignificant
insignificant |
|||||||||
t(df)(a vs. b)=c, the t test (df=degrees of freedom) (a=subgroup vs. b=control group/other subgroup), independent two-sided
Discussions
In our study, measuring of the transverse diameter by the second method to determine the volume of the prostate show a significant difference in subgroups vs the control group, and also between the subgroups 1 and 2, 3 and 1, which is useful to distinguish the frequency of nocturia between the subgroups 1 and 2, and between 3 and 1, while the measuring of the transverse diameter by the first method shows significant differences of all subgroups with nocturia compared with the control group, and also between the subgroups 1 and 2, but having no longer the same meaning between the remaining subgroups. Of course, it is about the same parameter, which should have the same characteristics, the difference being the method of calculation, thing which is also confirmed in statistical terms, the relationship between the transverse diameter of the prostate among the studied groups measured by the two methods of calculation was found to be strong or moderate. The craniocaudal diameter is the dimension that is kept relatively in the same range throughout the evolution of nocturia, from 1 to more than 4 times, apparently, the prostatic hypertrophy is not leading to a significant increase of the height of the prostate, the growth affecting other dimensions of the prostate. The correlation between the craniocaudal diameter of the prostate among the groups studied through the two calculation methods for prostate volume, is strong. The sagittal diameter has the most disappointing results for nocturia differentiation: measured in the first method has values significantly different in the subgroups with nocturia compared with the control group, but in the subgroups statistically significant differences were found only between the subgroup 3 and 1, and measured by the second method can be useful only to differentiate the presence of nocturia compared with the control group, with no statistically significant differences between subgroups with nocturia. Paradoxically, the sagittal diameter (anteroposterior) has the highest proportional increase in the nocturia group vs. the control group, compared with transverse diameter or craniocaudal (height), as well as in the study of Collins et al [6] on 430 men aged between 40 and 79 years undergoing transrectal ultrasonography (TRUS) which shows that BPH is characterized by a greater proportional increase in sagittal diameter compared to the length and the transverse diameter, and the correlation between the sagittal diameter of the prostate among the studied groups through the two calculation methods for prostate volume is strong and better than in the case of the transverse diameter, which shows that only the proportion of increase in dimensions is not enough to differentiate the nocturia symptoms, but only to highlight the general hypertrophy.
A study on 193 men aged between 40 and 79 years with the prostate volume measured by TRUS, which were followed up to three years [7] demonstrated the weak statistically significant differences relationship between the prostate variables and lower urinary tract symptoms (LUTS). It was found that only the basal nocturia correlate with prostate volume (r=0.202, p=0.0057), although there were some relationships also with the sagittal dimension of the prostate. We demonstrated [1] that the changes in the frequency of nocturia from which the prostate volume increase statistically significant than other frequency is only from 3-4 times.
Any uncertainty in determining through echography of the dimensions of prostate can have consequences in treatment planning, and much more, a multicenter prospective observational study from 2004 [8], showed a trend of most family doctors in primary care for the treatment without refering to the urologist. In principle it is beneficial to the patient by reducing the time to diagnosis and reducing costs, but the lack of common guidelines for family doctors and urologists, the diagnostic procedures chosen are not fully consistent with the best medical evidence.
In the search for a method which ensures the validity of the spatial precision of echographic system, the anatomical limits measured through spatially registered ultrasound (SRUS) images and computed tomography-derived contours (TDCs) that were acquired with a minimal time lapse [9] were compared. Verification using a phantom demonstrated the method to be spatially accurate to within +/-1 mm in the anteroposterior and lateral directions and +/-3 mm in the craniocaudal direction. The clinical results gathered on 8 patients demonstrated alignment between the US and the CTDCs to be 0 mm in the anteroposterior and lateral directions and 2 mm in the craniocaudal direction. The lateral dimension of the prostate indicated by the CTDCs was larger than that indicated by US imaging in all cases and on average by 9 mm. The height of the prostate in the sagittal direction was larger on average by 3 mm using CTDCs than US, and was larger by 5 mm or more in 3 out of 7 cases. These results suggest that the ultrasound measurements result in generally lower measurements than those through CTDCs, although the number of cases from the cited study was small.
The correlations of measurement of the transverse diameter of the prostate using trans-abdominal ultrasound with the transverse diameter determined using TRUS was investigated in a study [10] by reviewing the records of 287 patients who had undergone both trans-abdominal pelvic ultrasound for determination of post void residual urine volume and TRUS for evaluation of elevated serum prostate-specific antigen levels or abnormal digital rectal examinations. There was a strong correlation between the transverse diameter determined using trans-abdominal ultrasound and that determined using TRUS. The equation that converts the trans-abdominal transverse prostate measurement into its equivalent transrectal counterpart: transrectal measurement (cm)=0.5109X[trans-abdominal measurement (cm)]+2.2935. The possibility of conversion through an equation proves that the series of results by both methods has no errors in the measurement of the dimensions by different examiners. In our study, all measurements were performed by the same examiner, with the same device, with no measurements of the same size where there was no statistically significant relationship.
From the measured dimensions of the prostate, the craniocaudal diameter is the only size with a strong relation in all subgroups with nocturia. It is the parameter that has the lowest variability for the different frequency of the nocturia. In conclusion, the craniocaudal diameter is the parameter that is maintaining itself relatively between the same ranges throughout the evolution of nocturia from 1 to more than 4 times per night. Prostatic hypertrophy apparently does not increase the height of the prostate, the growth affecting other dimensions.
The strongest correlation of all measured dimensions was in the subgroup 4, even though the mean of these values was closest to the general population. This suggest that not the global increase in the size of the prostate is the cause of the nocturia frequency of 4 times or more, as the prostate maintains it’s proportions and even the dimensions closest to the mean of population, but the hypertrophy of the transition zone around the urethra.
The comparison of the mean increase in prostate size in the hypertrophy has shown that the sagittal diameter has the largest proportional increase in the nocturia group vs. the control group, comparative with the transverse or craniocaudal diameter, but only the proportion of the increase of dimensions is not enough to solve the odds of the nocturia symptoms, and just only to highlight the general hypertrophy.
Conclusions
The craniocaudal diameter is the size which is maintaining itself relatively between the same ranges throughout the evolution of the nocturia, the hypertrophy affecting other dimensions. It is possible that not the global increase in the size of the prostate is the cause of the nocturia frequency of 4 times or more, but the hypertrophy of the transition zone around the urethra.
The sagittal diameter has the largest proportional increase in the nocturia group compared with the control group, but only this is not enough to solve the odds of the nocturia symptoms, but only to highlight the general hypertrophy.
Measurement of the perimeter of the prostate in sagittal section may provide clues regarding the odds of frequency of nocturia, at least for the level of 3-4 times.
The measurement of the transverse diameter by method 1 would be useful for the odds of the frequency of nocturia of 1-2 times vs. 2-3 times, and through the second method can distinguish the nocturia frequency between subgroup 1 and 2, and between 3 and 1.
An algorithm that uses transverse diameter and the sagittal perimeter could make a difference between the frequency of nocturia 1-2 times, 2-3 times and 3-4 times, frequencies which constitute an absolute majority of the nocturia frequency at the presentation of the patient to the family doctor’s office.
To confirm or to rule out the results of this study further research, particularly in multicenter studies is required.
References
- Bumbuluț C, Bumbuluț A, Bumbuluț B, Negru AD, Balaj NS. Clinico-Echographic Correlations between Prostate Volume and Frequency of the Nocturia in Prostatic Hypertrophy. Med Con 2014; 4(36):37-42.
- Maxim R, Bolboacă SD, Maxim A, Stanca DV, Coman I. Admission Profile of Patients with Lower Urinary Tract Symptoms. Med Con 2014;4(36):13-18.
- Doo SW, Lee HJ, Ahn J, Kim JH, Yun JH, Yang WJ, et al. Strong impact of nocturia on sleep quality in patients with lower urinary tract symptoms. World J Mens Health 2012;30(2):123-30.
- Berges R, Oelke M. Age-stratified normal values for prostate volume, PSA, maximum urinary flow rate, IPSS, and other LUTS/BPH indicators in the German male community-dwelling population aged 50 years or older. World J Urol 2011;29(2):171-8.
- Emberton M, Marberger M, de la Rosette J. Understanding patient and physician perceptions of benign prostatic hyperplasia in Europe: The Prostate Research on Behaviour and Education (PROBE) Survey. Int J Clin Pract 2008;62(1):18-26.
- Collins GN, Lee RJ, Russell EB, Raab GM, Hehir M. Ultrasonically determined patterns of enlargement in benign prostatic hyperplasia. Br J Urol 1993;71(4):451-6.
- Lee AJ, Garraway WM, Simpson RJ. Pathophysiological relationships between lower urinary tract symptoms and the prostate do not strengthen over time. Prostate 1998;37(1):5-9.
- Spatafora S; Canepa G; Migliari R; Rotondo S; Mandressi A; Puppo P. Diagnostic procedures by Italian general practitioners in response to lower urinary tract symptoms in male patients: a prospective study. Curr Med Res Opin 2004; 20(5):713-21.
- Molloy JA, Srivastava S, Schneider BF. A method to compare supra-pubic ultrasound and CT images of the prostate: technique and early clinical results. Med Phys 2004;31(3):433-42.
- Doebler RW. Transverse prostate measurement obtained using transabdominal ultrasound: possible role in transurethral needle ablation of the prostate. Urology 2000;55(4):564-7.